Prometheusメトリクスに基づいて Kubernetes Pod をオートスケーリングさせてみた

はじめに
平素は大変お世話になっております。
クイックガードのパー子です。
とある案件で Prometheus のメトリクスを使って Kubernetes Pod をオートスケーリングさせる必要が生じたので、その実現方法を調べてみました。
実現方法
Kubernetes の Horizontal Pod Autoscaler (= HPA) には、Pod の CPU やメモリ使用量に基づいたスケーリングだけでなく、独自のメトリクス を用いることもできる仕組みが用意されています。
この仕組みに則って HPA が Prometheusメトリクスを参照するためには、両者を仲介するアダプターが必要になります。
選択肢
アダプターの候補として、現在では以下のどちらかを利用する事例が多いようです。
(参考: LibHunt)
Prometheus Adapter はその名のとおり Prometheus専用のアダプターですが、KEDA は Prometheus を含む多数の イベントソース をサポートしています。

ウォークスルー
両者について、それぞれインストールからスケーリング・ルールの投入まで、オートスケーリングの実現にあたっての一連の流れを見ていきましょう。
Prometheus Adapter
README のとおり、Helm でインストールするのが簡単です。
その際、Prometheusサーバのエンドポイントとスケーリング・ルールを Helm の パラメータ として与えます。
---
# Prometheus エンドポイント
prometheus:
  url: 'http://prometheus-server.default.svc.cluster.local'
  port: 80

# スケーリング・ルール
rules:
  default: false
  custom:
    - ...
    - ...
スケーリング・ルールは以下のような形式になっており、
      # 1. Discovery
    - seriesQuery: 'nginx_http_requests_total{namespace!="", pod!=""}'

      # 2. Association
      resources:
        overrides:
          namespace:
            resource: 'namespace'
          pod:
            resource: 'pod'

      # 3. Naming
      name:
        matches: '^(.*)_total'
        as: '${1}_per_second'

      # 4. Querying
      metricsQuery: 'sum(rate(<<.Series>>{<<.LabelMatchers>>}[2m])) by (<<.GroupBy>>)'
Discovery 〜 Querying の 4つのステップ で 1つのスケーリング・ルールが構成されています。
- Discovery, which specifies how the adapter should find all Prometheus metrics for this rule.
- Association, which specifies how the adapter should determine which Kubernetes resources a particular metric is associated with.
- Naming, which specifies how the adapter should expose the metric in the custom metrics API.
- Querying, which specifies how a request for a particular metric on one or more Kubernetes objects should be turned into a query to Prometheus.
少し複雑ですが、どういう流れでスケーリング・ルールが組み上がるのか、Configuration Walkthroughs を読むと理解しやすいです。
なお、<< >> で囲まれた箇所はテンプレートとなっており、たとえば <<.Series>> ならばメトリクス名である nginx_http_requests_total で置換されます。
オートスケーリング・ルールで指定した Prometheusメトリクスが custom.metrics.k8s.io の APIリソースとして登録されているはずです。
$ kubectl get --raw '/apis/custom.metrics.k8s.io/v1beta1' | jq .
{
  "kind": "APIResourceList",
  "apiVersion": "v1",
  "groupVersion": "custom.metrics.k8s.io/v1beta1",
  "resources": [
    {
      "name": "namespaces/nginx_http_requests_per_second",
      "singularName": "",
      "namespaced": false,
      "kind": "MetricValueList",
      "verbs": [
        "get"
      ]
    },
    {
      "name": "pods/nginx_http_requests_per_second",
      "singularName": "",
      "namespaced": true,
      "kind": "MetricValueList",
      "verbs": [
        "get"
      ]
    }
  ]
}
続いて、このメトリクスを参照するように HorizontalPodAutoscalerリソースを作成します。
---
apiVersion: 'autoscaling/v2'
kind: 'HorizontalPodAutoscaler'
metadata:
  name: 'sample-app-hpa'
spec:
  scaleTargetRef:
    apiVersion: 'apps/v1'
    kind: 'Deployment'
    name: 'sample-app-deployment'
  minReplicas: 1
  maxReplicas: 10
  metrics:
    - type: 'Pods'
      pods:
        metric:
          name: 'nginx_http_requests_per_second'
        target:
          type: 'AverageValue'
          averageValue: '100'
以上でオートスケーリングの設定は完了です。
HTTPリクエスト数に応じて Pod が増減するようになります。
KEDA
インストール方法はいくつか選択肢がありますが、Helm が簡単です。
Prometheus Adapter とは異なり、Prometheusサーバのエンドポイントやスケーリング・ルールは ScaledObjectリソース で定義します。
---
apiVersion: 'keda.sh/v1alpha1'
kind: 'ScaledObject'
metadata:
  name: 'sample-app-scaledobject'
spec:
  scaleTargetRef:
    kind: 'Deployment'
    name: 'sample-app-deployment'
  minReplicaCount: 1
  maxReplicaCount: 10
  triggers:
    - type: 'prometheus'
      metadata:
        serverAddress: 'http://prometheus-server.default.svc.cluster.local:80'
        metricName: 'nginx_http_requests_per_second'
        query: 'sum(rate(nginx_http_requests_total{pod=~"sample-app-deployment-.*"}[2m]))'
        threshold: '100'
spec.triggers はイベントソースごとに記述内容が異なります。
(Prometheus の場合は こちら)
これを apply すると、external.metrics.k8s.io に APIリソースが登録されます。
(KEDA は Customメトリクスではなく Externalメトリクスを使います。)
$ kubectl get --raw '/apis/external.metrics.k8s.io/v1beta1' | jq .
{
  "kind": "APIResourceList",
  "apiVersion": "v1",
  "groupVersion": "external.metrics.k8s.io/v1beta1",
  "resources": [
    {
      "name": "s0-prometheus-nginx_http_requests_per_second",
      "singularName": "",
      "namespaced": true,
      "kind": "ExternalMetricValueList",
      "verbs": [
        "get"
      ]
    }
  ]
}
ScaledObjectリソースの作成と同時に HorizontalPodAutoscalerリソースも自動で作成されます。
$ kubectl get scaledobjects.keda.sh
NAME                      SCALETARGETKIND      SCALETARGETNAME         MIN   MAX   TRIGGERS     AUTHENTICATION   READY   ACTIVE   FALLBACK   AGE
sample-app-scaledobject   apps/v1.Deployment   sample-app-deployment   1     10    prometheus                    True    True     False      29m

$ kubectl get hpa
NAME                               REFERENCE                          TARGETS       MINPODS   MAXPODS   REPLICAS   AGE
keda-hpa-sample-app-scaledobject   Deployment/sample-app-deployment   3/100 (avg)   1         10        1          29m
Prometheus Adapter と比べると、とても簡単ですね。
KEDA を使ってみる
ウォークスルーで見たとおり、KEDA のほうがお手軽かつ直感的で、スケーリング・ルールが個々の ScaledObjectリソースで表現されていて取り回しがよいため、今回は KEDA を採用することにしました。
もう少し KEDA を詳しく知るために、さらに以下のシナリオで実際にスケーリングを試してみます。
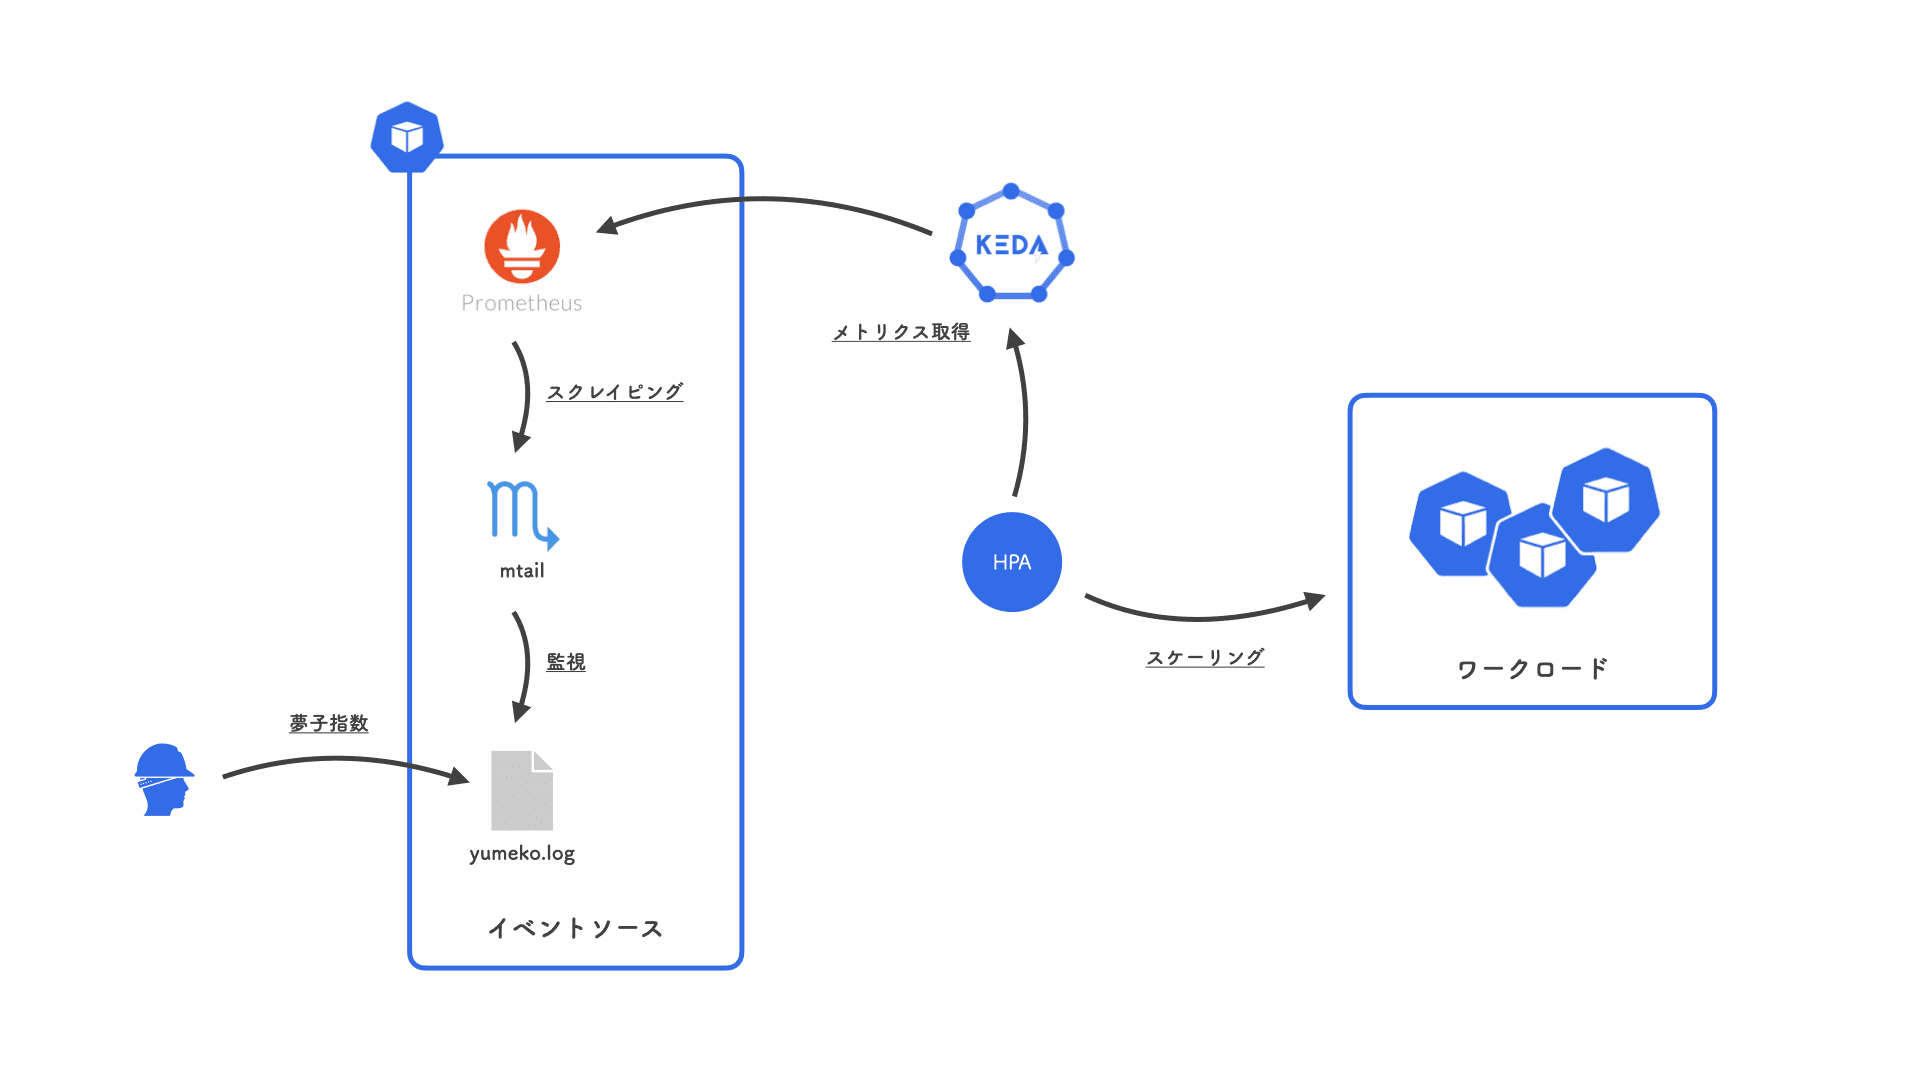
私、gondawara_yumeko のそのときのテンションを示す指標である「夢子指数」を Expose して、その値に連動してスケーリングするようにします。
夢子指数はテンションに応じて /var/log/yumeko.log に手動で記録し、mtail で Prometheusサーバに公開します。
クラスタの準備
まず適当な Kubernetesクラスタを用意します。
(今回は kind を使いました。)
クラスタを立ち上げたら、オートスケーリングの対象とする Nginx をデプロイします。
nginx.yaml
---
apiVersion: 'apps/v1'
kind: 'Deployment'
metadata:
  name: 'nginx-deployment'
  namespace: 'nginx'
spec:
  replicas: 2
  selector:
    matchLabels:
      app: 'nginx'
  template:
    metadata:
      labels:
        app: 'nginx'
    spec:
      containers:
        - name: 'nginx'
          image: 'nginx:1.22.0-alpine'
          ports:
            - containerPort: 80
$ kubectl create namespace nginx
namespace/nginx created

$ kubectl apply -f ./nginx.yaml
deployment.apps/nginx-deployment created

$ kubectl get pod -n nginx
NAME                               READY   STATUS    RESTARTS   AGE
nginx-deployment-c8457bccd-cnfb8   1/1     Running   0          9s
nginx-deployment-c8457bccd-z6pq7   1/1     Running   0          9s
KEDA のインストール
Helm で KEDA をインストールします。
$ helm repo add kedacore https://kedacore.github.io/charts
"kedacore" has been added to your repositories

$ helm repo update
Hang tight while we grab the latest from your chart repositories...
...Successfully got an update from the "kedacore" chart repository
Update Complete. ⎈Happy Helming!⎈

$ kubectl create namespace keda
namespace/keda created

$ helm install keda kedacore/keda --namespace keda
NAME: keda
LAST DEPLOYED: Thu Jun 23 13:01:38 2022
NAMESPACE: keda
STATUS: deployed
REVISION: 1
TEST SUITE: None
無事に KEDA がインストールされました。
$ kubectl get pod -n keda
NAME                                               READY   STATUS    RESTARTS   AGE
keda-operator-7b56458b7f-nkfhk                     1/1     Running   0          2m18s
keda-operator-metrics-apiserver-6b57c64d9c-q7cf4   1/1     Running   0          2m18s
Prometheus のセットアップ
Prometheusサーバも同じ Kubernetesクラスタ上にセットアップします。
prometheus.yaml
---
apiVersion: 'v1'
kind: 'ConfigMap'
metadata:
  name: 'prometheus-config'
  namespace: 'prometheus'
data:
  prometheus.yml: |-
    global:
      scrape_interval: 15s
      evaluation_interval: 15s

    scrape_configs:
      - job_name: 'prometheus'
        static_configs:
          - targets:
              - 'localhost:9090'

      - job_name: 'mtail'
        static_configs:
          - targets:
              - 'localhost:3903'

  yumeko.mtail: |-
    gauge yumeko_gauge

    /^yumeko (\d+)$/ {
      yumeko_gauge = $1
    }

---
apiVersion: 'apps/v1'
kind: 'Deployment'
metadata:
  name: 'prometheus-deployment'
  namespace: 'prometheus'
spec:
  replicas: 1
  selector:
    matchLabels:
      app: 'prometheus'
  template:
    metadata:
      labels:
        app: 'prometheus'
    spec:
      containers:
        - name: 'prometheus'
          image: 'prom/prometheus:v2.36.1'
          ports:
            - containerPort: 9090
          volumeMounts:
            - name: 'prometheus-config'
              mountPath: '/etc/prometheus/prometheus.yml'
              subPath: 'prometheus.yml'
              readOnly: true

        - name: 'yumeko-exporter'
          image: 'debian:bullseye-20220527-slim'
          command:
            - 'sh'
            - '-c'
            - |-
              apt-get update
              apt-get install -y curl

              curl -sL https://github.com/google/mtail/releases/download/v3.0.0-rc49/mtail_3.0.0-rc49_Linux_x86_64.tar.gz \
                | tar -x -z -C /usr/local/bin/ -f - mtail

              touch /var/log/yumeko.log

              mtail -progs /etc/mtail/yumeko.mtail -logs /var/log/yumeko.log
          ports:
            - containerPort: 3903
          volumeMounts:
            - name: 'prometheus-config'
              mountPath: '/etc/mtail/yumeko.mtail'
              subPath: 'yumeko.mtail'
              readOnly: true

      volumes:
        - name: 'prometheus-config'
          configMap:
            name: 'prometheus-config'

---
apiVersion: 'v1'
kind: 'Service'
metadata:
  name: 'prometheus-service'
  namespace: 'prometheus'
spec:
  selector:
    app: 'prometheus'
  ports:
    - protocol: 'TCP'
      port: 9090
      targetPort: 9090
$ kubectl create namespace prometheus
namespace/prometheus created

$ kubectl apply -f ./prometheus.yaml
configmap/prometheus-config created
deployment.apps/prometheus-deployment created
service/prometheus-service created
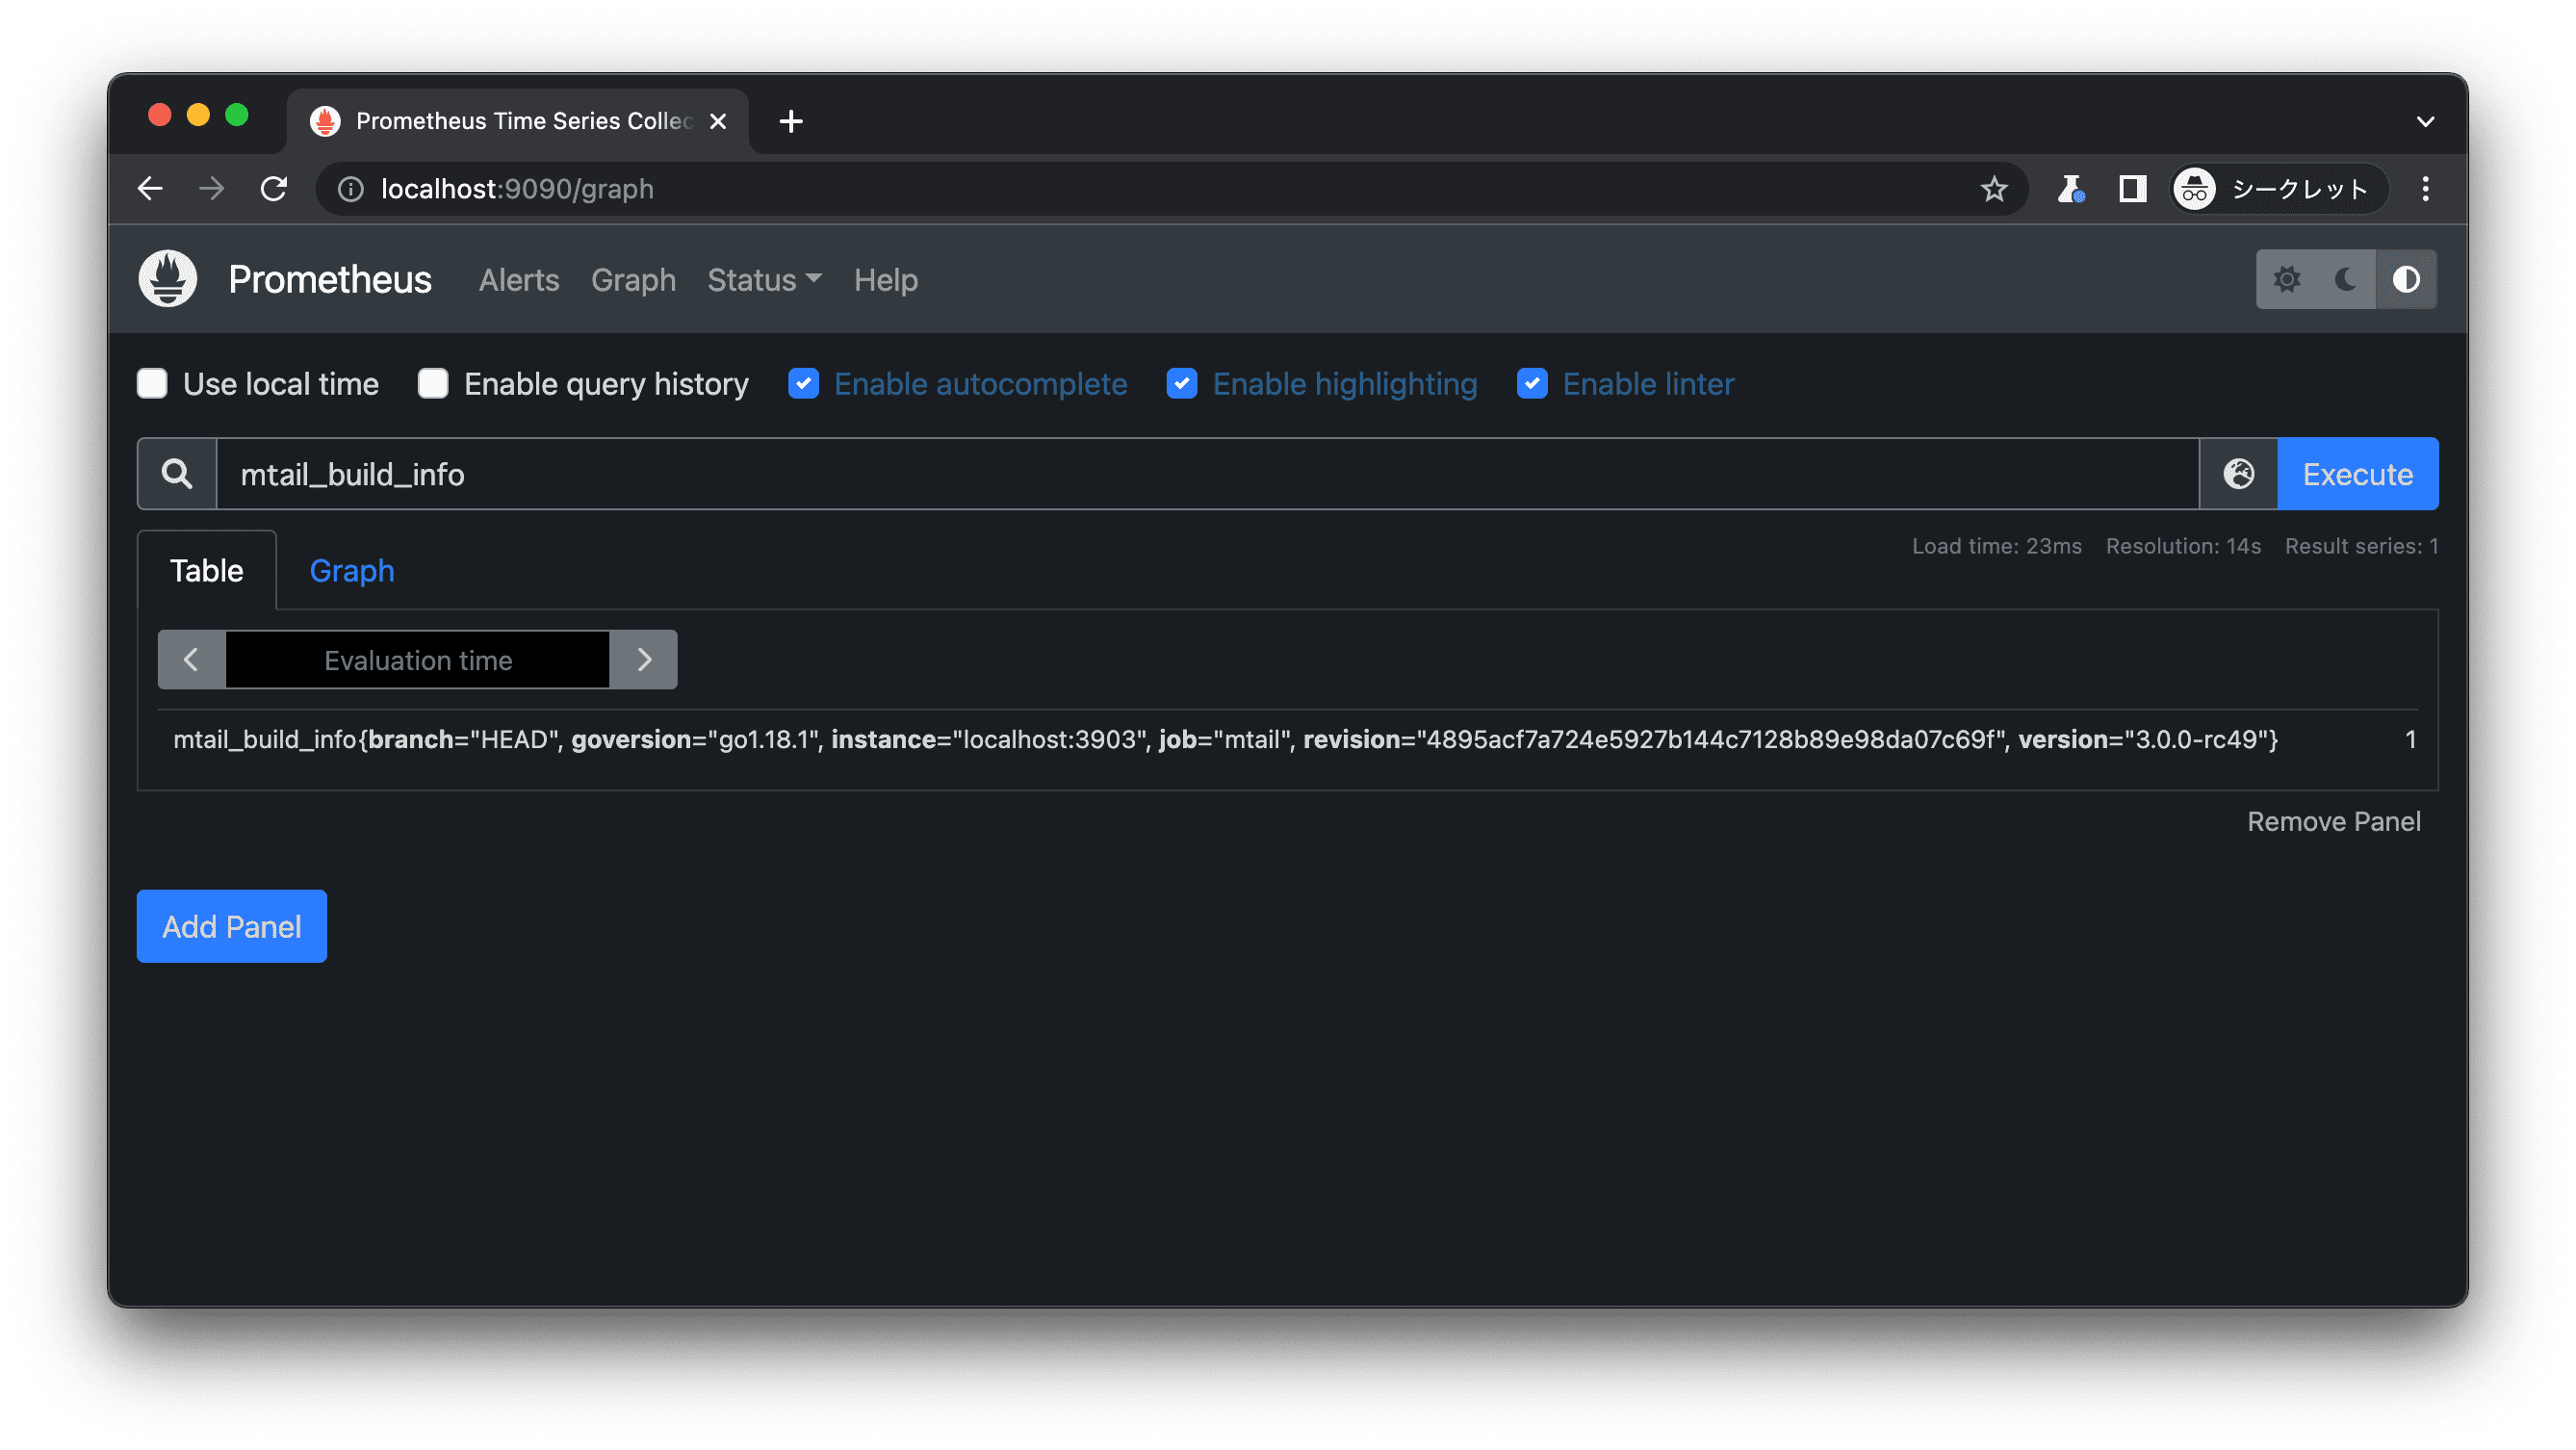
ポート・フォワーディングして http://localhost:9090 にアクセスすると Prometheus のコンソールが表示されます。
$ kubectl port-forward service/prometheus-service 9090:9090 -n prometheus
Forwarding from 127.0.0.1:9090 -> 9090
Forwarding from [::1]:9090 -> 9090
夢子指数の取得
夢子指数を取得してみます。
prometheus-deployment-* Pod の yumeko-exporterコンテナ上、/var/log/yumeko.log に yumeko {{数値}} という形式で書き込んだ値が夢子指数として Export されます。
まず、夢子指数 = 10 としてみます。
$ kubectl get pod -n prometheus
NAME                                     READY   STATUS    RESTARTS   AGE
prometheus-deployment-768bb5648c-djvm7   2/2     Running   0          56m

$ kubectl exec prometheus-deployment-768bb5648c-djvm7 -c yumeko-exporter -n prometheus -- sh -c 'echo "yumeko 10" >> /var/log/yumeko.log'
ポート 9090 をフォワーディングしたうえで、Prometheus に問い合わせてみましょう。
メトリクス名は yumeko_gauge です。
$ curl -s "http://localhost:9090/api/v1/query?query=yumeko_gauge&time=$( date '+%s' )" | jq .
{
  "status": "success",
  "data": {
    "resultType": "vector",
    "result": [
      {
        "metric": {
          "__name__": "yumeko_gauge",
          "instance": "localhost:3903",
          "job": "mtail",
          "prog": "yumeko.mtail"
        },
        "value": [
          1655968976,
          "10"
        ]
      }
    ]
  }
}
値だけ抽出してみます。
$ curl -s "http://localhost:9090/api/v1/query?query=yumeko_gauge&time=$( date '+%s' )" | jq -r '.data.result[].value[1]'
10
狙いどおり夢子指数 = 10 となっていますね。
続いて、夢子指数 = 15 に変えてみます。
$ kubectl exec prometheus-deployment-768bb5648c-djvm7 -c yumeko-exporter -n prometheus -- sh -c 'echo "yumeko 15" >> /var/log/yumeko.log'

$ curl -s "http://localhost:9090/api/v1/query?query=yumeko_gauge&time=$( date '+%s' )" | jq -r '.data.result[].value[1]'
15
よさそうです。
ScaledObject の作成
夢子指数に応じて Pod数が増減するように、ScaledObjectリソースを作成します。
scaledobject.yaml
---
apiVersion: 'keda.sh/v1alpha1'
kind: 'ScaledObject'
metadata:
  name: 'nginx-deployment-scaledobject'
  namespace: 'nginx'
spec:
  scaleTargetRef:
    name: 'nginx-deployment'
  minReplicaCount: 1
  maxReplicaCount: 10
  triggers:
    - type: 'prometheus'
      metadata:
        serverAddress: 'http://prometheus-service.prometheus.svc.cluster.local:9090'
        metricName: 'yumeko_gauge'
        query: 'yumeko_gauge'
        threshold: '223'
夢子指数が 223 (フ・ジ・サン = 富士山) を超えるほど高まったらスケーリング発動です。
また、無制限にレプリカを増やすのではなく、1〜10個の範囲内で増減するように制限しています。
$ kubectl apply -f scaledobject.yaml
scaledobject.keda.sh/nginx-deployment-scaledobject created
ScaledObject、HorizontalPodAutoscaler ともに正常に作成されました。
$ kubectl get scaledobjects.keda.sh -n nginx
NAME                            SCALETARGETKIND      SCALETARGETNAME    MIN   MAX   TRIGGERS     AUTHENTICATION   READY   ACTIVE   FALLBACK   AGE
nginx-deployment-scaledobject   apps/v1.Deployment   nginx-deployment   1     10    prometheus                    True    True     False      52s

$ kubectl get hpa -n nginx
NAME                                     REFERENCE                     TARGETS           MINPODS   MAXPODS   REPLICAS   AGE
keda-hpa-nginx-deployment-scaledobject   Deployment/nginx-deployment   7500m/223 (avg)   1         10        2          70s
なお、前セクションで夢子指数 = 15 と設定したにも関わらず HPA のメトリクス現在値が 7500m (=7.5) となっているのは、レプリカ数 = 2 で除算しているためです。
(詳細は Appendix を参照してください。)
夢子指数を変動させる
最後に、夢子指数を変動させて、実際のレプリカ数の動きを見てみます。
夢子指数 = 15 のまま数分ほど放っておいたところ、閾値 (= 223) を下回っているため、レプリカ数が当初の 2 から下限である 1 に減っていました。
(イベント履歴にも New size: 1; reason: All metrics below target と記録されています。)
$ kubectl get pod -n nginx
NAME                               READY   STATUS    RESTARTS   AGE
nginx-deployment-c8457bccd-wztbz   1/1     Running   0          10m

$ kubectl describe hpa keda-hpa-nginx-deployment-scaledobject -n nginx
Warning: autoscaling/v2beta2 HorizontalPodAutoscaler is deprecated in v1.23+, unavailable in v1.26+; use autoscaling/v2 HorizontalPodAutoscaler
Name:                                                   keda-hpa-nginx-deployment-scaledobject
Namespace:                                              nginx
Labels:                                                 app.kubernetes.io/managed-by=keda-operator
                                                        app.kubernetes.io/name=keda-hpa-nginx-deployment-scaledobject
                                                        app.kubernetes.io/part-of=nginx-deployment-scaledobject
                                                        app.kubernetes.io/version=2.7.1
                                                        scaledobject.keda.sh/name=nginx-deployment-scaledobject
Annotations:                                            <none>
CreationTimestamp:                                      Tue, 28 Jun 2022 10:12:26 +0900
Reference:                                              Deployment/nginx-deployment
Metrics:                                                ( current / target )
  "s0-prometheus-yumeko_gauge" (target average value):  15 / 223
Min replicas:                                           1
Max replicas:                                           10
Deployment pods:                                        1 current / 1 desired
Conditions:
  Type            Status  Reason              Message
  ----            ------  ------              -------
  AbleToScale     True    ReadyForNewScale    recommended size matches current size
  ScalingActive   True    ValidMetricFound    the HPA was able to successfully calculate a replica count from external metric s0-prometheus-yumeko_gauge(&LabelSelector{MatchLabels:map[string]string{scaledobject.keda.sh/name: nginx-deployment-scaledobject,},MatchExpressions:[]LabelSelectorRequirement{},})
  ScalingLimited  False   DesiredWithinRange  the desired count is within the acceptable range
Events:
  Type    Reason             Age    From                       Message
  ----    ------             ----   ----                       -------
  Normal  SuccessfulRescale  2m40s  horizontal-pod-autoscaler  New size: 1; reason: All metrics below target
閾値を超えるように、夢子指数 = 300 にカチ上げてみましょう。
$ kubectl exec prometheus-deployment-768bb5648c-djvm7 -c yumeko-exporter -n prometheus -- sh -c 'echo "yumeko 300" >> /var/log/yumeko.log'
当然というか狙いどおりというか、レプリカ数が 2 に増えました。
メトリクス現在値は 300 / 2 = 150 となっています。
$ kubectl get pod -n nginx
NAME                               READY   STATUS    RESTARTS   AGE
nginx-deployment-c8457bccd-wqmqv   1/1     Running   0          33s
nginx-deployment-c8457bccd-wztbz   1/1     Running   0          12m

$ kubectl describe hpa keda-hpa-nginx-deployment-scaledobject -n nginx
Warning: autoscaling/v2beta2 HorizontalPodAutoscaler is deprecated in v1.23+, unavailable in v1.26+; use autoscaling/v2 HorizontalPodAutoscaler
Name:                                                   keda-hpa-nginx-deployment-scaledobject
Namespace:                                              nginx
Labels:                                                 app.kubernetes.io/managed-by=keda-operator
                                                        app.kubernetes.io/name=keda-hpa-nginx-deployment-scaledobject
                                                        app.kubernetes.io/part-of=nginx-deployment-scaledobject
                                                        app.kubernetes.io/version=2.7.1
                                                        scaledobject.keda.sh/name=nginx-deployment-scaledobject
Annotations:                                            <none>
CreationTimestamp:                                      Tue, 28 Jun 2022 10:12:26 +0900
Reference:                                              Deployment/nginx-deployment
Metrics:                                                ( current / target )
  "s0-prometheus-yumeko_gauge" (target average value):  150 / 223
Min replicas:                                           1
Max replicas:                                           10
Deployment pods:                                        2 current / 2 desired
Conditions:
  Type            Status  Reason              Message
  ----            ------  ------              -------
  AbleToScale     True    ReadyForNewScale    recommended size matches current size
  ScalingActive   True    ValidMetricFound    the HPA was able to successfully calculate a replica count from external metric s0-prometheus-yumeko_gauge(&LabelSelector{MatchLabels:map[string]string{scaledobject.keda.sh/name: nginx-deployment-scaledobject,},MatchExpressions:[]LabelSelectorRequirement{},})
  ScalingLimited  False   DesiredWithinRange  the desired count is within the acceptable range
Events:
  Type    Reason             Age    From                       Message
  ----    ------             ----   ----                       -------
  Normal  SuccessfulRescale  5m40s  horizontal-pod-autoscaler  New size: 1; reason: All metrics below target
  Normal  SuccessfulRescale  18s    horizontal-pod-autoscaler  New size: 2; reason: external metric s0-prometheus-yumeko_gauge(&LabelSelector{MatchLabels:map[string]string{scaledobject.keda.sh/name: nginx-deployment-scaledobject,},MatchExpressions:[]LabelSelectorRequirement{},}) above target
夢子指数 = 5,000 まで爆上げしてみます。
$ kubectl exec prometheus-deployment-768bb5648c-djvm7 -c yumeko-exporter -n prometheus -- sh -c 'echo "yumeko 5000" >> /var/log/yumeko.log'
10 レプリカまで増えました。
メトリクス現在値が 5,000 / 10 = 500 となり、閾値の 223 を超えていますが、これ以上はスケーリングしません。
レプリカ数の増減範囲を 1〜10 と制限しているためです。
$ kubectl get pod -n nginx
NAME                               READY   STATUS    RESTARTS   AGE
nginx-deployment-c8457bccd-d242w   1/1     Running   0          55s
nginx-deployment-c8457bccd-g2pc8   1/1     Running   0          55s
nginx-deployment-c8457bccd-h8qpp   1/1     Running   0          55s
nginx-deployment-c8457bccd-k54tz   1/1     Running   0          70s
nginx-deployment-c8457bccd-ksqjs   1/1     Running   0          55s
nginx-deployment-c8457bccd-n7xpx   1/1     Running   0          70s
nginx-deployment-c8457bccd-r8mcv   1/1     Running   0          40s
nginx-deployment-c8457bccd-wqmqv   1/1     Running   0          12m
nginx-deployment-c8457bccd-wztbz   1/1     Running   0          24m
nginx-deployment-c8457bccd-xw9hx   1/1     Running   0          40s

$ kubectl describe hpa keda-hpa-nginx-deployment-scaledobject -n nginx
Warning: autoscaling/v2beta2 HorizontalPodAutoscaler is deprecated in v1.23+, unavailable in v1.26+; use autoscaling/v2 HorizontalPodAutoscaler
Name:                                                   keda-hpa-nginx-deployment-scaledobject
Namespace:                                              nginx
Labels:                                                 app.kubernetes.io/managed-by=keda-operator
                                                        app.kubernetes.io/name=keda-hpa-nginx-deployment-scaledobject
                                                        app.kubernetes.io/part-of=nginx-deployment-scaledobject
                                                        app.kubernetes.io/version=2.7.1
                                                        scaledobject.keda.sh/name=nginx-deployment-scaledobject
Annotations:                                            <none>
CreationTimestamp:                                      Tue, 28 Jun 2022 10:12:26 +0900
Reference:                                              Deployment/nginx-deployment
Metrics:                                                ( current / target )
  "s0-prometheus-yumeko_gauge" (target average value):  500 / 223
Min replicas:                                           1
Max replicas:                                           10
Deployment pods:                                        10 current / 10 desired
Conditions:
  Type            Status  Reason            Message
  ----            ------  ------            -------
  AbleToScale     True    ReadyForNewScale  recommended size matches current size
  ScalingActive   True    ValidMetricFound  the HPA was able to successfully calculate a replica count from external metric s0-prometheus-yumeko_gauge(&LabelSelector{MatchLabels:map[string]string{scaledobject.keda.sh/name: nginx-deployment-scaledobject,},MatchExpressions:[]LabelSelectorRequirement{},})
  ScalingLimited  True    TooManyReplicas   the desired replica count is more than the maximum replica count
Events:
  Type    Reason             Age   From                       Message
  ----    ------             ----  ----                       -------
  Normal  SuccessfulRescale  17m   horizontal-pod-autoscaler  New size: 1; reason: All metrics below target
  Normal  SuccessfulRescale  12m   horizontal-pod-autoscaler  New size: 2; reason: external metric s0-prometheus-yumeko_gauge(&LabelSelector{MatchLabels:map[string]string{scaledobject.keda.sh/name: nginx-deployment-scaledobject,},MatchExpressions:[]LabelSelectorRequirement{},}) above target
  Normal  SuccessfulRescale  73s   horizontal-pod-autoscaler  New size: 4; reason: external metric s0-prometheus-yumeko_gauge(&LabelSelector{MatchLabels:map[string]string{scaledobject.keda.sh/name: nginx-deployment-scaledobject,},MatchExpressions:[]LabelSelectorRequirement{},}) above target
  Normal  SuccessfulRescale  58s   horizontal-pod-autoscaler  New size: 8; reason: external metric s0-prometheus-yumeko_gauge(&LabelSelector{MatchLabels:map[string]string{scaledobject.keda.sh/name: nginx-deployment-scaledobject,},MatchExpressions:[]LabelSelectorRequirement{},}) above target
  Normal  SuccessfulRescale  43s   horizontal-pod-autoscaler  New size: 10; reason: external metric s0-prometheus-yumeko_gauge(&LabelSelector{MatchLabels:map[string]string{scaledobject.keda.sh/name: nginx-deployment-scaledobject,},MatchExpressions:[]LabelSelectorRequirement{},}) above target
以上、Prometheusメトリクスに基づいて、自然な使い心地でスケーリングを実現できることがわかりました。
Appendix
メトリクスの値からレプリカ数を決定する計算方式として、AverageValue と Value の 2つがあります。
(Value は KEDA v2.7 でサポートされました。)
ScaledObjectリソースの spec.triggers[].metricType で指定できます。
公式ドキュメントの 具体例 によると、「キューの滞留状態に依存するワーカーが 3レプリカ稼働している」という状況において、それぞれ以下のようにレプリカ数が決定されます。
(ただし、概念的には、レプリカ数に着目するのではなく「AverageValue の場合はメトリクス値が現在のレプリカ数で除算される一方、Value はそのままの値が使われる」というようにメトリクス値の扱いを変えるものと捉えたほうがわかりやすいかと思います。)
| 算出方式 | 対象メトリクス | 閾値 | 現在値 | 望ましいレプリカ数 (x) |
|---|---|---|---|---|
AverageValue | メッセージ数 | 5個 | 20個 | 20 / x <= 5x >= 20 / 5x >= 4 |
Value | キュー滞留時間の平均 | 5ミリ秒 | 20ミリ秒 | (レプリカ数と滞留時間が反比例するものと仮定する。)3 * 20 / x <= 5x >= 3 * 20 / 5x >= 12 |
まとめ
Prometheusメトリクスに基づく Pod の水平オートスケーリングの実現方式として、Prometheus Adapter と KEDA を見てみました。
両者を比較し、今回は簡単かつ直感的に導入できる KEDA を採用しました。
Kubernetes の独自メトリクスの仕組みを意識することなく、狙いどおり手軽にオートスケーリングを実現できました。
今後ともよろしくお願い申し上げます。
当記事の図表には Kubernetes Icons Set、CNCF Logos を使用しています。