Grafana 4.0 (Beta) の Alerting 機能を使ってみる

概要
Grafana 4.0 から実装された Alerting を試してみる
現在(2016/11/11) Alerting 対応の DataSource は以下のみらしい
- Graphite
- Prometheus
- InfluxDB
- OpenTSDB
Graphite でやってみる
環境
- Grafana Server
- CentOS Linux release 7.2.1511 (Core)
- grafana-4.0.0-1478693311beta1
- DataSource
- graphite-web-0.9.15-1
- carbon-0.9.15-1
- whisper-0.9.15-1
- Metrics Collector
- telegraf-1.0.1
Grafana インストール
ダウンロードはこちらから
既に grafana インストール済みの環境があるので
$ sudo rpm -Uvh grafana-4.0.0-1478693311beta1.x86_64.rpm
grafana 側で以下の設定を有効化しておく(メール通知する場合は、SMTP 設定もやっとく)
[alerting]
execute_alerts = true
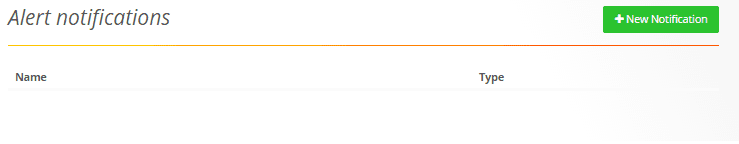
通知先設定
メニューより Alerting → notifications 選択

New Notification で通知設定
メール通知設定

Save して通知先設定完了
Alerting 設定
グラフ Edit 画面に Alert Tab が追加されたので
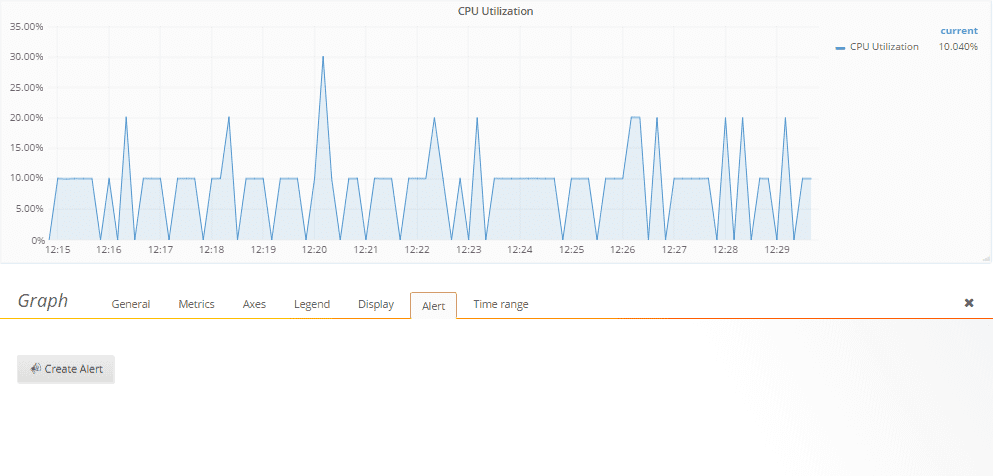
Create Alert して Alert 設定

閾値はグラフ横の health ボタン上下で設定できる
Notifications より先ほど作成した通知先を設定

Alert 通知
閾値を低めに設定してしばらくするとアラートメール受信した

グラフ上にもアラート履歴が annotation として表示される
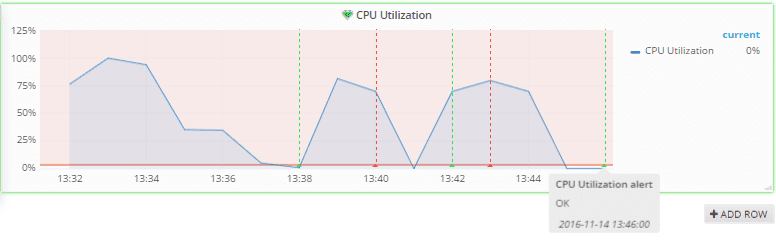
アラート履歴
